
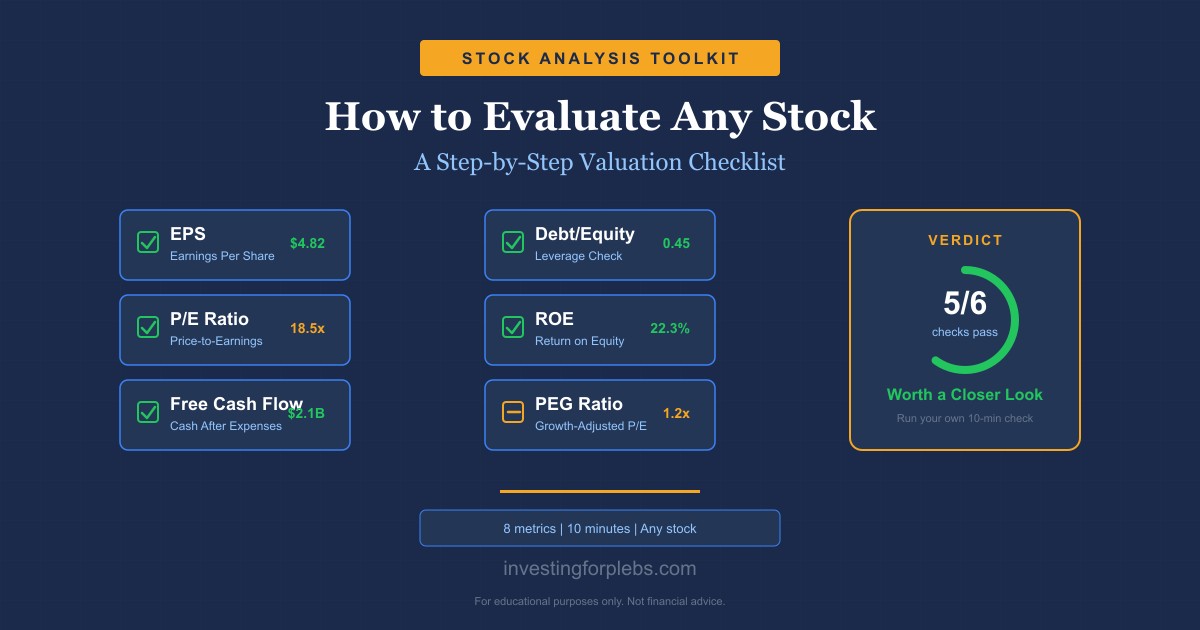
TL;DR: Evaluating a stock isn’t about predicting the future. It’s about understanding what you’re paying for and whether that price makes sense given what the company actually earns, owns, and owes. This guide walks you through eight key metrics (EPS, P/E, PEG, price-to-book, free cash flow, debt-to-equity, and ROE) — plus a printable checklist so you can run the whole analysis in about 10 minutes.
Table of Contents
- The 5-Minute Stock Check: What to Look at First
- Earnings Power: EPS and Revenue Growth
- Is the Price Fair? P/E Ratio Basics
- Adjusting for Growth: The PEG Ratio
- What the Company Owns: Price-to-Book Ratio
- Cash Is King: Free Cash Flow
- Reading the Balance Sheet: Debt-to-Equity
- Is Management Effective? Return on Equity
- Spotting Red Flags Before You Buy
- The Pleb’s 10-Minute Stock Checklist
The 5-Minute Stock Check
Before you run any numbers, step back and ask three basic questions:
1. Do I understand what this company does?
If you can’t explain the business in two sentences, that’s not a deal-breaker, but it is a reason to do more homework before committing money. The simpler your understanding of a business, the easier it is to spot when something has changed.
2. Is the business growing, shrinking, or flat?
Pull up the last three to five years of revenue and earnings. A growing business isn’t automatically worth buying (price matters), but a shrinking business needs a very compelling reason to own. Look for consistency: steady, predictable growth is almost always better than explosive growth that reverses sharply.
3. What’s the market thinking?
Check the stock’s 52-week high and low. Where does the current price sit relative to those extremes? A stock near its 52-week low could be a bargain, or it could be down for good reason. A stock near its 52-week high might be expensive, or might be there because the business keeps delivering. Context matters, but knowing where you stand helps frame everything that follows.
This five-minute check doesn’t replace deeper analysis. It’s a filter. If the answers are unsatisfying, dig in. If one of them stops you cold, move on. There are thousands of stocks. You don’t have to force any of them.
Earnings Power: EPS and Revenue Growth
Earnings per share (EPS) is the starting point for almost any stock analysis. It tells you how much profit the company generated per share of stock outstanding. The formula is simple: net income divided by shares outstanding.
But a single EPS number in isolation doesn’t tell you much. What you want is a trend.
- Is EPS growing year over year?
- Is it growing faster or slower than revenue?
- Is growth coming from genuine business expansion, or from share buybacks that inflate the per-share figure?
Revenue growth matters here too. A company that’s growing EPS while revenue is flat (or declining) may be cutting costs rather than building something better. That’s not always bad, but it’s worth knowing.
What to look for: At a minimum, EPS should be positive and growing. For a business you’re excited about, you want to see several consecutive years of EPS growth, ideally alongside revenue growth of at least 5-10% annually.
You can dig deeper with an earnings report: the quarterly document every public company must file. It breaks down revenue by segment, explains one-time charges, and gives guidance on what management expects next. Learning to read it is one of the most valuable investing skills you can develop.
One caution: “adjusted” EPS strips out costs that companies prefer not to show. Always check what’s been excluded and whether it seems legitimate. The more a company relies on “adjusted” numbers, the harder it is to trust the headline figure.
Is the Price Fair? P/E Ratio Basics
The price-to-earnings ratio (P/E) is the most widely used valuation metric in investing. It answers a simple question: for every dollar of earnings this company generates, how many dollars are investors willing to pay?
The formula: Share price ÷ Earnings per share = P/E ratio
A P/E of 20 means investors are paying $20 for every $1 of earnings. Whether that’s expensive or cheap depends entirely on context.
A few useful benchmarks:
– The S&P 500’s long-run average P/E is roughly 15-17
– Growth companies (fast-expanding tech, biotech) often trade at P/Es of 30-60+
– Mature, slow-growing businesses often trade at P/Es of 10-15
– A P/E below 10 can signal deep value, or a struggling business
This is why comparing P/E to industry peers matters so much. A software company at P/E 35 might be reasonable. A bank at P/E 35 would be very expensive. P/E ratios vary significantly by industry, so always compare apples to apples.
P/E also looks backward by default (trailing P/E) or forward (forward P/E, based on analyst estimates). Forward P/E is more useful for valuing a growing company, but estimates can be wrong. Trailing P/E is more reliable but can make fast-growers look expensive.
What to look for: A P/E below the industry average can signal value. A P/E well above it requires the company to justify that premium through superior growth or margins. If it can’t, the stock is likely expensive.
Adjusting for Growth: The PEG Ratio
The P/E ratio has a blind spot: it doesn’t account for how fast a company is growing. A company with a P/E of 30 growing at 30% annually may actually be cheaper than a company with a P/E of 15 growing at 3%.
The PEG ratio fixes this by dividing the P/E by the company’s expected earnings growth rate.
Formula: P/E ÷ Annual EPS growth rate = PEG ratio
Rough guidelines:
– PEG below 1.0: Often considered undervalued relative to growth
– PEG around 1.0: Fairly valued
– PEG above 2.0: Potentially expensive, or the market is pricing in high confidence in that growth
The PEG ratio is most useful for growth-oriented companies. It’s less helpful for mature, stable businesses where earnings growth is slow and predictable, or for companies with cyclical earnings that vary widely from year to year.
What to look for: Use PEG as a complement to P/E, not a replacement. If P/E looks high but PEG looks reasonable (under 1.5), the company might be worth the premium. If both look high, you’d want a very compelling reason to own the stock at that price.
One caveat: PEG uses estimated future growth, and estimates are often optimistic. When calculating PEG, using the past five years of EPS growth as a more conservative proxy for future growth is a reasonable approach.
What the Company Owns: Price-to-Book Ratio
The price-to-book ratio (P/B) compares what investors are paying for a company to what the company actually owns minus what it owes (its “book value”).
Formula: Share price ÷ Book value per share = P/B ratio
Book value is essentially the liquidation value: if you sold all assets and paid all debts, what would be left for shareholders? P/B shows you how many dollars of market value you’re buying per dollar of net assets.
- P/B below 1.0: You’re paying less than book value. The stock might be deeply undervalued, or the assets may be worth less than reported.
- P/B of 1-3: Common range for many industries
- P/B above 5: The business must generate strong returns on those assets to justify the premium
P/B is most useful for asset-heavy businesses: banks, insurance companies, manufacturers, and real estate. It’s less useful for software companies or service businesses where the most valuable “assets” (intellectual property, brand, talent) don’t show up on a balance sheet.
What to look for: Compare P/B to the company’s industry. A bank trading at P/B of 1.0 might be fairly valued; a software company at P/B of 15 might be completely reasonable given its profit margins and growth. Context is everything. P/B shines as a sanity check: if a company trades significantly below book value, something is either very wrong or potentially very interesting.
Cash Is King: Free Cash Flow
Earnings can be managed. Cash cannot be faked as easily.
Free cash flow (FCF) is the real cash a business generates after paying its operating costs and reinvesting in itself (capital expenditures). It’s the money left over that a company can use to pay dividends, buy back stock, pay down debt, or fund acquisitions.
Formula: Operating cash flow − Capital expenditures = Free cash flow
Why does FCF matter so much? Because accounting rules allow companies to recognize revenue before cash actually arrives, delay expense recognition, and make numerous estimates that can flatter reported earnings. Cash flow is harder to dress up.
Warning signs in cash flow:
– EPS consistently growing while FCF is flat or shrinking (earnings may not reflect real economics)
– Huge capital expenditure requirements that absorb most or all of operating cash flow (the business may not generate much real value)
– Negative FCF for multiple years without a clear path to profitability
What to look for: Ideally, a company produces positive and growing FCF, and its FCF per share is reasonably close to its reported EPS. You can find free cash flow on the cash flow statement in any earnings report. A useful shorthand: FCF yield (FCF per share ÷ stock price) works like an earnings yield. The higher it is, the more cash return you’re potentially getting for your investment.
Reading the Balance Sheet: Debt-to-Equity
A company’s profitability tells you how the business performs. Its balance sheet tells you how resilient it is when things go wrong.
The debt-to-equity ratio (D/E) measures how much debt a company carries relative to the equity its shareholders own. It’s a simple but powerful indicator of financial risk.
Formula: Total debt ÷ Total shareholders’ equity = D/E ratio
- D/E below 1.0: Generally low leverage, meaning the company has more equity than debt
- D/E of 1.0-2.0: Moderate leverage, common in many industries
- D/E above 2.0: Elevated leverage, not automatically bad, but worth scrutinizing
- Highly leveraged (D/E 4+): Can be appropriate for banks and utilities, but dangerous in cyclical businesses
High debt isn’t always bad. Leverage can amplify returns in good times. But it also amplifies losses in bad times, and a company with heavy debt in a recession or rising-rate environment can find itself in serious trouble.
Learning to read a balance sheet properly (not just the D/E ratio, but understanding current vs. long-term debt, maturity schedules, and interest coverage) gives you a much fuller picture of financial health.
What to look for: Always compare D/E to industry norms. Utilities and real estate companies typically carry high debt because their cash flows are stable and predictable. For a tech or consumer company, a D/E above 2.0 warrants more investigation. The key question: can this company comfortably service its debt even if revenue drops 20-30%?
Is Management Effective? Return on Equity
All the revenue and earnings in the world don’t mean much if management is inefficient at deploying the money shareholders have entrusted to them. Return on equity (ROE) measures exactly that.
Formula: Net income ÷ Shareholders’ equity = ROE
ROE tells you how much profit the company generates for every dollar of shareholders’ equity. Think of it as the efficiency score for management’s use of capital.
- ROE below 10%: Generally considered low; the company may be generating modest returns for the risk taken
- ROE of 15-20%: Good, and considered the standard benchmark for a quality business
- ROE above 20%: Excellent; suggests a genuine competitive advantage or strong operational efficiency
One important caveat: debt inflates ROE. When a company borrows heavily to fund operations, it reduces the equity base, which mechanically boosts ROE. A company with ROE of 30% and a D/E ratio of 4.0 may look impressive on paper, but it’s taking on substantial financial risk to achieve those returns. Always check ROE alongside the D/E ratio to understand whether the returns are genuine or debt-driven.
What to look for: A consistent ROE of 15% or higher over five or more years is a strong signal of a quality business. Compare ROE to industry peers, as some sectors (banking, utilities) have structurally lower ROEs due to the nature of the business. What you want to see is a company that consistently outperforms its industry average.
Spotting Red Flags Before You Buy
Knowing what to look for is valuable. Knowing what to avoid can save you real money.
Here are the most common warning signs to watch before you commit to a stock (you can find a full breakdown in how to tell if a stock is overvalued).
Red flag checklist:
- P/E dramatically above industry average with no clear growth justification: you may be paying for hype, not value
- Revenue growing but earnings consistently shrinking: margins are compressing, which can signal competitive pressure or rising costs
- EPS growing but FCF flat or declining: the company may be using accounting flexibility to inflate reported earnings
- Rapidly rising debt without proportional revenue or profit growth: management may be borrowing to paper over operating weakness
- Frequent “one-time” charges that appear every single year: one-time means it happened once; recurring “one-time” charges mean something structural is happening
- Insider selling on a large scale: executives and directors buying stock is a bullish signal; heavy, broad selling deserves investigation
- Guidance consistently missing expectations: management either can’t forecast their own business or isn’t being straight with investors
- Auditor changes or qualified audit opinions: these are rare and should always be investigated thoroughly
No single red flag is necessarily a deal-breaker. A company going through a rough patch with rising debt and weak FCF might be a turnaround opportunity, or it might be in permanent decline. Red flags don’t give you answers, but they tell you where to focus your attention.
The meta-rule: If something feels off and you can’t explain it with reasonable confidence, that’s a signal. There’s no reward for owning a company you don’t fully understand.
The Pleb’s 10-Minute Stock Checklist
Use this checklist to run a quick evaluation on any stock. It won’t replace deep research, but it’ll catch most of the obvious problems and confirm the basics before you spend more time.
| # | What to Check | What You’re Looking For | Where to Find It |
|---|---|---|---|
| 1 | Business model | Can you explain it in 2 sentences? | Company website, annual report |
| 2 | Revenue trend (3-5 years) | Consistent growth of 5%+ annually | Income statement |
| 3 | EPS trend (3-5 years) | Positive and growing | Income statement |
| 4 | P/E ratio | Near or below industry average | Finance sites, earnings report |
| 5 | PEG ratio | Below 1.5 is generally favorable | Finance sites (or calculate: P/E ÷ growth rate) |
| 6 | Price-to-Book | Compare to industry; below 3 preferred for most sectors | Balance sheet + stock price |
| 7 | Free Cash Flow | Positive and growing; close to reported EPS | Cash flow statement |
| 8 | Debt-to-Equity | Below 2.0 for most sectors; compare to industry peers | Balance sheet |
| 9 | Return on Equity | 15%+ consistently; not artificially inflated by debt | Income statement + balance sheet |
| 10 | Red flags scan | None of the warning signs above | All of the above |
Scoring: If you’re checking all 10 boxes with comfortable answers, that’s a stock worth spending more time on. If 3 or more raise serious questions, spend extra time investigating, or move on.
Not financial advice. This guide is educational and intended to help you develop your own analysis framework. Always do your own research before making any investment decision. Past performance of any metric or strategy doesn’t guarantee future results.
Want to go deeper on any of these metrics? We have full articles on every concept covered here:
- What Does EPS Mean?
- How to Read an Earnings Report
- What Is the P/E Ratio?
- What Is a Good P/E Ratio by Industry?
- What Is the PEG Ratio?
- What Is Price-to-Book Ratio?
- What Is Free Cash Flow?
- What Is Debt-to-Equity Ratio?
- How to Read a Balance Sheet
- What Is Return on Equity?
- How to Tell If a Stock Is Overvalued
- What Is the 52-Week High and Low?
- How to Analyze a Stock for Beginners: The 5-Question Checklist
Get the Sunday Pleb — free market insights in plain English, every week. Subscribe →


Leave a Reply