
TL;DR: Return on equity (ROE) measures how much profit a company generates for every dollar its shareholders have invested. The formula: net income divided by shareholders’ equity. A good ROE is generally 15% or higher, but industry context matters. The catch: a high ROE driven by heavy debt rather than genuine profitability can be a warning sign, not a green flag. Here’s how to read it right.
Warren Buffett has called return on equity one of the most important metrics for evaluating a business. Not revenue growth. Not market share. ROE.
That’s worth paying attention to.
ROE cuts through the noise and asks a simple question: is this company actually good at turning its shareholders’ money into more money? A company can have billions in revenue and still be terrible at this. ROE tells you which category a business falls into.
What Is Return on Equity?
Return on equity is a profitability ratio that measures how efficiently a company uses shareholders’ equity to generate profit.
Shareholders’ equity is what’s left over after you subtract everything a company owes (its liabilities) from everything it owns (its assets). Think of it as the company’s net worth from the shareholders’ perspective. You can find it on the balance sheet.
ROE answers: for every dollar of equity sitting in this business, how much profit did management squeeze out of it?
A company with an ROE of 20% generated 20 cents of profit for every dollar of shareholder equity. A company with an ROE of 5% generated only a nickel. Same idea as a savings account interest rate, but for the whole business.
The ROE Formula, Explained Simply
The formula is straightforward:
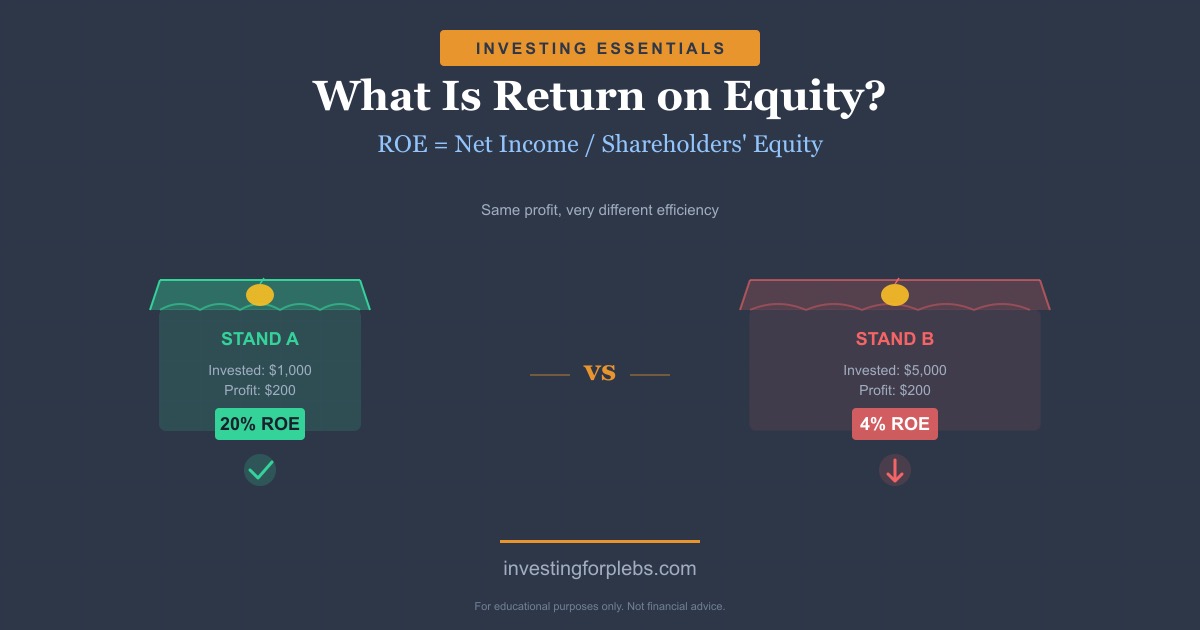
ROE = Net Income / Shareholders’ Equity
Or expressed as a percentage:
ROE = (Net Income / Shareholders’ Equity) × 100
Here’s a concrete example. Say a company earned $500 million in net income last year, and its shareholders’ equity was $2.5 billion. The ROE calculation:
$500M / $2,500M = 0.20, or 20% ROE
That’s a strong number. It means management turned every $1 of shareholder investment into $1.20 of value.
The Lemonade Stand Analogy
Picture two lemonade stands.
Stand A: You invested $1,000 of your own money to set it up. By summer’s end, you made $200 in profit. Your ROE is 20%.
Stand B: Your neighbor invested $5,000 to set up her stand (nicer equipment, premium location). She made the same $200 in profit. Her ROE is 4%.
Both stands generated the same profit in dollar terms. But yours did it far more efficiently. Your neighbor’s business looks bigger on paper but it’s much worse at actually converting investment into return.
That’s the core insight ROE captures: not just how much profit, but how much profit relative to what was put in.
Where to Find the Numbers
Net income appears on the income statement, typically labeled “Net income” or “Net earnings.” Shareholders’ equity is on the balance sheet, sometimes called “Total stockholders’ equity” or “Total equity.” Most financial data sites (Yahoo Finance, Macrotrends, company investor relations pages) display both numbers directly. Annual data is most commonly used for ROE to smooth out quarterly fluctuations.
What Is a Good ROE?
As a general benchmark, an ROE above 15% is considered solid. Many professional investors look for sustained ROE above 20% as a signal of a genuinely excellent business.
But context matters enormously.
| Industry | Typical ROE Range |
|---|---|
| Technology (software) | 20–50%+ |
| Consumer staples | 15–30% |
| Retail | 15–25% |
| Banking / Financial services | 8–15% |
| Utilities | 8–12% |
| Capital-intensive manufacturing | 5–12% |
A bank with an ROE of 12% might be perfectly healthy. The same 12% at a software company would raise serious questions about why they’re not more efficient.
This is why comparing ROE across industries can mislead you. Banks are highly regulated and capital-constrained. Utilities carry enormous fixed assets. Software companies can scale revenue without proportionally scaling equity. You’re measuring different machines with the same ruler.
The most useful comparison: a company’s ROE against its own historical average and against its direct industry peers. If a company’s ROE has been declining steadily over five years while competitors held steady, that’s a signal worth investigating.
ROE vs. ROA: What’s the Difference?
Return on assets (ROA) is a close cousin of ROE, but it measures profit against total assets rather than just equity:
ROA = Net Income / Total Assets
The key distinction: ROA accounts for all assets on the balance sheet, whether they were funded by shareholders or by borrowed money (debt). ROE only counts shareholder-funded capital.
Why does this matter? Because a company can borrow heavily to buy more assets, which boosts revenue and profit without the shareholders contributing more equity. This inflates ROE without improving the underlying business efficiency.
A quick example: Two companies each earn $100 million in profit. Company X has $500 million in equity and $0 in debt (ROE: 20%). Company Y has $300 million in equity and $200 million in debt (ROE: 33%). On ROE alone, Company Y looks better. But when you look at ROA, Company X (which has $500M in total assets) has a 20% ROA, while Company Y (with $500M in total assets including debt) also has a 20% ROA. Same underlying efficiency; the debt in Company Y just made the ROE look better.
This is why serious stock analysts look at both metrics together. ROA gives you a cleaner view of operational efficiency. ROE gives you the shareholder-specific perspective.
When ROE Can Be Misleading
A high ROE is usually good news. But not always. There are two common situations where it can give you a false sense of confidence.
1. Debt-Fueled ROE
Because ROE is calculated using equity (not total capital), companies that carry a lot of debt will tend to have lower equity, which mathematically inflates ROE.
Remember: Equity = Assets minus Liabilities. Load up on debt, and equity shrinks. Shrink the denominator in the ROE formula, and ROE jumps. The company doesn’t have to get better at anything — it just has to borrow more.
This is why you should always check a company’s debt-to-equity ratio alongside ROE. If a company has a sky-high ROE but a dangerously high D/E ratio, the impressive number may be a product of leverage, not operational excellence. A leveraged business can generate great ROE during good times and blow up during downturns when debt payments become unmanageable.
2. Share Buybacks Shrinking Equity
When a company buys back its own shares, those shares are retired. This reduces the total shareholders’ equity sitting on the balance sheet (since buybacks are recorded as negative equity). Less equity means ROE rises mechanically, even if earnings don’t change.
Large, mature companies (think major consumer brands and tech giants) often conduct aggressive buyback programs. Their ROE can look extraordinary, but some of that is mathematical sleight of hand rather than genuine operational improvement. This isn’t necessarily bad; buybacks can reflect management confidence and create shareholder value. But it means you can’t evaluate ROE in isolation.
3. Negative Equity (Edge Case)
If a company has negative shareholders’ equity (usually because of accumulated losses or especially aggressive buybacks), ROE becomes meaningless or misleading. You might get a negative number that looks mathematically like a “negative ROE” but actually represents a structurally distressed balance sheet, not a profitable business.
How to Use ROE When Analyzing Stocks
ROE works best as part of a toolkit, not as a standalone verdict.
Step 1: Check ROE trend over time. A single year’s ROE is less useful than five years of history. Is ROE expanding, stable, or eroding? Consistent 20%+ ROE over a decade suggests durable competitive advantage. Declining ROE often means the business is facing pricing pressure, rising costs, or increasing competition.
Step 2: Compare to industry peers. Find two or three direct competitors and compare ROE. If one company consistently outperforms its peers on ROE without carrying more debt, that’s a meaningful signal about management quality and business model strength.
Step 3: Check what’s driving it. The DuPont analysis breaks ROE into three components: profit margin (how much of revenue is profit), asset turnover (how efficiently assets generate revenue), and financial leverage (how much debt is in the mix). If high ROE is driven almost entirely by leverage rather than margins or turnover, that’s a yellow flag.
Step 4: Cross-reference with debt levels. Always pair ROE with the D/E ratio. High ROE + low D/E = genuine profitability. High ROE + high D/E = leverage amplification. The difference matters a lot during economic downturns.
Step 5: Connect it to EPS. If ROE is strong, you’d generally expect earnings per share to be growing over time. If ROE looks great but EPS is flat or declining, something isn’t adding up and it’s worth digging into the financials more carefully.
A Quick Checklist
Before getting excited about a high ROE, run through these questions:
- What is the D/E ratio? (If high, ROE may be debt-inflated.)
- Has the company been buying back stock aggressively? (Buybacks reduce equity and boost ROE mechanically.)
- How does this ROE compare to competitors in the same industry?
- Is this ROE consistent over five-plus years, or is it a recent spike?
The Bottom Line
Return on equity is one of the best single-number shortcuts for evaluating how well a company is run. It tells you whether management is actually good at turning shareholder capital into profit, which is ultimately the whole point of investing in a business.
Use it as a first filter. A consistently high ROE (15%+) with manageable debt levels is a strong sign of a well-run business with a real competitive edge. But always look underneath the number — debt and buybacks can make a mediocre business look like a great one on ROE alone.
Pair it with the debt-to-equity ratio, ROA, and earnings per share, and you’ll have a much clearer picture of what you’re actually looking at.
This content is for educational purposes only and does not constitute financial advice. investingforplebs.com is not a registered investment advisor. Please consult a qualified financial professional before making investment decisions.


Leave a Reply