
TL;DR: An expense ratio is the annual fee a fund charges to cover its operating costs, expressed as a percentage of your investment. A 0.03% expense ratio on a $10,000 investment costs you $3 a year. A 1.00% expense ratio costs you $100. The gap looks small — but over decades, it compounds into a meaningful difference in what you actually keep.
The fee you never see on an invoice
When you invest in a fund — whether it’s an ETF, an index fund, or a mutual fund — someone has to run it. Managers, analysts, compliance teams, and administrative staff all cost money. The expense ratio is how funds recover those costs.
Here’s the part that catches people off guard: you never write a check for this fee. It’s deducted directly from the fund’s assets, which means it quietly reduces your returns without ever appearing as a line item in your account. The fund’s net asset value (NAV) — the price per share — already reflects the fee being taken out.
That invisibility is part of why expense ratios don’t get enough attention. But they should.
How the math works
The expense ratio is expressed as an annual percentage. A fund with a 0.50% expense ratio charges 50 cents per year for every $100 you have invested in it.
If you invest $10,000:
| Expense Ratio | Annual Cost |
|---|---|
| 0.03% (typical index ETF) | $3 |
| 0.20% (mid-range) | $20 |
| 0.50% (actively managed) | $50 |
| 1.00% (high-cost active fund) | $100 |
The absolute dollar amounts don’t look scary. But here’s the problem: you’re not just paying on your original investment. You’re paying on every dollar your portfolio grows to — and you’re paying it every single year.
Why small differences compound into big numbers
This is where the power of compounding works against you if you’re not careful.
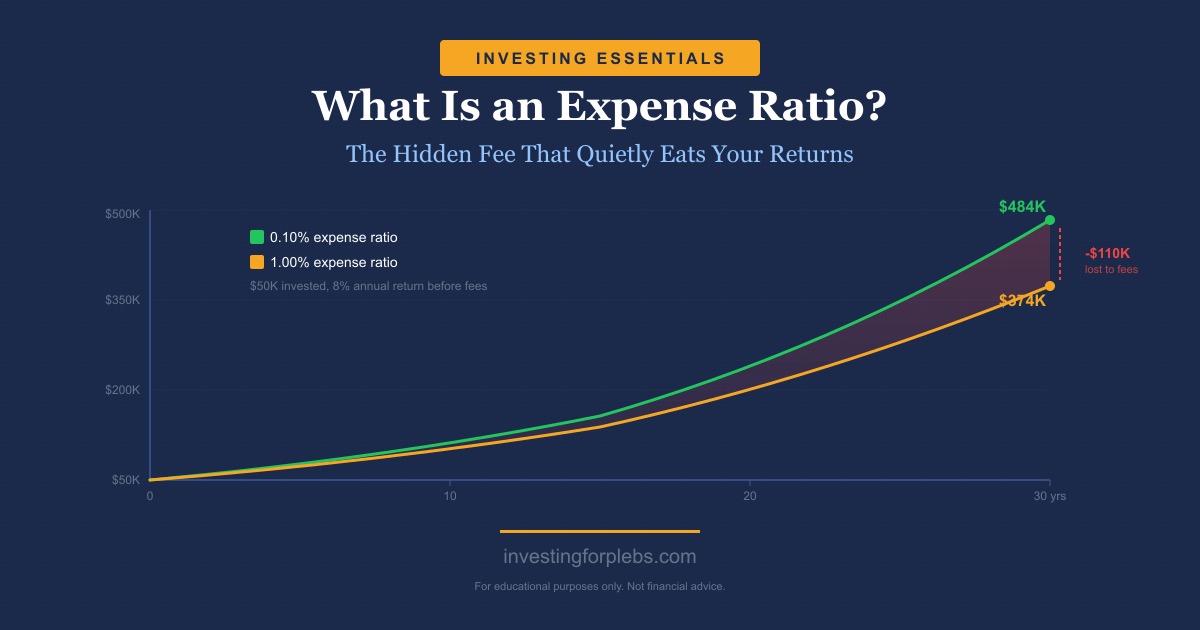
Imagine two investors each put $50,000 into funds earning the same 8% annual return before fees. One pays a 0.10% expense ratio. The other pays 1.00%.
After 30 years:
| Expense Ratio | Portfolio Value |
|---|---|
| 0.10% | ~$484,000 |
| 1.00% | ~$381,000 |
That’s a $103,000 difference from a 0.90% annual fee gap. The higher-fee investor gave away roughly 21% of their final portfolio value to costs, not to poor stock picking or bad luck — just to fees that compounded year after year.
The lesson: a fraction of a percent matters far more than it looks on paper.
What counts as a good expense ratio?
Broadly, lower is better. Here’s a rough guide:
Excellent (under 0.10%): Passively managed index ETFs and index mutual funds from low-cost providers like Vanguard, Fidelity, and iShares typically land here. Some are as low as 0.015% (Fidelity’s S&P 500 index fund, for example).
Reasonable (0.10% to 0.50%): Some specialty index funds, sector ETFs, and international index funds fall in this range. Still generally acceptable, especially if the fund provides exposure you can’t easily replicate cheaper.
Expensive (above 0.50%): Actively managed funds, thematic ETFs, and alternative-strategy funds often charge here. The fee is only worth it if the fund consistently delivers returns that justify the extra cost — which research consistently shows most active funds do not.
Avoid (above 1.00%): High-cost mutual funds often come with expense ratios above 1%, sometimes well above. Unless there’s a very specific reason to own it, you’re likely overpaying significantly.
How expense ratios differ by fund type
Not all funds charge the same way.
Index funds and passive ETFs track a market index without much human intervention. Low turnover, minimal research costs, and no portfolio manager salary to cover. Expense ratios are typically under 0.10%.
Actively managed mutual funds pay portfolio managers and research teams to pick stocks. All that human labor costs money. Expense ratios of 0.50% to 1.50% are common, and some specialty funds go higher.
Thematic and sector ETFs sit in the middle. They may be technically passive (tracking an index) but the index itself covers a niche area — clean energy, robotics, cybersecurity — which tends to mean higher costs than a broad-market fund.
Target-date funds (common in 401(k) plans) are funds-of-funds that automatically adjust your allocation over time. Fees vary widely; some employer plans offer institutional share classes with low costs, while others carry higher fees.
When comparing ETFs vs. index funds, expense ratios are one of the most important factors to examine side by side.
How to find a fund’s expense ratio
You’ll find it in a few places:
- The fund’s fact sheet or prospectus: Every fund is required to disclose its expense ratio in its prospectus. It’s usually listed in the “Fees and Expenses” section.
- Your brokerage platform: When you search for a fund on Fidelity, Schwab, Vanguard, or most other platforms, the expense ratio shows up in the fund overview.
- Morningstar or ETF.com: These sites aggregate fund data and make it easy to compare expense ratios across similar funds.
When you’re comparing two funds that do roughly the same thing, the expense ratio is often the single most useful differentiator.
Common misconceptions
“A higher fee means better performance.” Research says the opposite is generally true. Studies by Morningstar and Vanguard have consistently found that expense ratio is one of the best predictors of future performance — low-cost funds tend to outperform high-cost ones over long periods, largely because of the math above.
“The expense ratio is the only fee I pay.” Not always. Some mutual funds also charge sales loads (commissions) or 12b-1 fees (marketing costs baked into the expense ratio). ETFs may have a bid-ask spread cost when you buy or sell. Read the full fee table, not just the expense ratio line.
“My 401(k) funds are fee-free.” They’re not. Employer-sponsored plans often offer institutional share classes with lower fees than retail versions, but there’s always an expense ratio. Check your plan’s fund lineup — the differences between your options may surprise you.
The bottom line
The expense ratio won’t make headlines, but it’s one of the highest-leverage decisions you make as an investor. You control it completely, and the benefit compounds every year you hold the fund.
When in doubt: all else being equal, choose the cheaper fund. The math is on its side.
This content is for educational purposes only and does not constitute financial advice. investingforplebs.com is not a registered investment advisor. Please consult a qualified financial professional before making investment decisions.
Enjoyed this? Get the Sunday Pleb every week — free market insights in plain English. Subscribe →
Leave a Reply